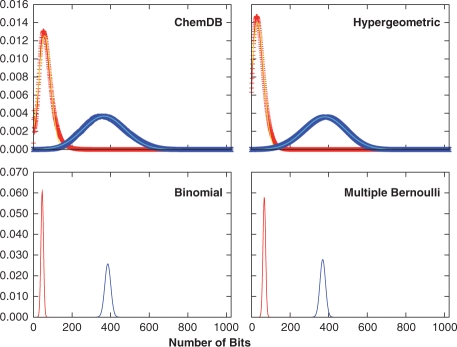
Fig. 2.
Intersection (red) and union (blue) distributions calculated empirically from the ChemDB fingerprints, and from the various fingerprint models described above. For the ChemDB results, the distributions were empirically sampled (‘+’), and fit to Gaussians (solid lines). The calculated hypergeometric/Gaussian distributions are shown with ‘+’ symbols, and the Gaussian fits in solid lines, which are good approximations of the empirical distributions. In the case of the binomial and multiple Bernoulli models, the Gaussian approximations are shown (solid lines), which can be calculated directly from the model parameters. In all cases, the distributions are well approximated by Gaussian distributions.

