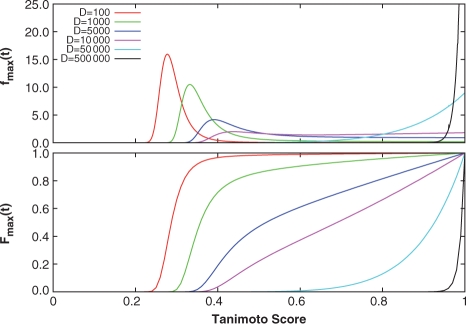
Fig. 4.
Maximum and cumulative maximum Tanimoto score distributions derived from Equations (17) and (18) using the empirical ratio-of-Gaussian parameters for different database sizes D (red: D=100, green: D=1000, blue: D=5000, magenta: D=10000, cyan: D=50000, black: D=500000). As D increases for fmax(t), the distribution shifts from being concentrated around relatively low scores, to scores concentrated around 1.0. For small database sizes, the cumulative distributions Fmax(t) quickly increase and saturate toward lower scores, while at larger databases sizes, the distributions remain small over most of the score range and rapidly increase as they approach 1.0.

