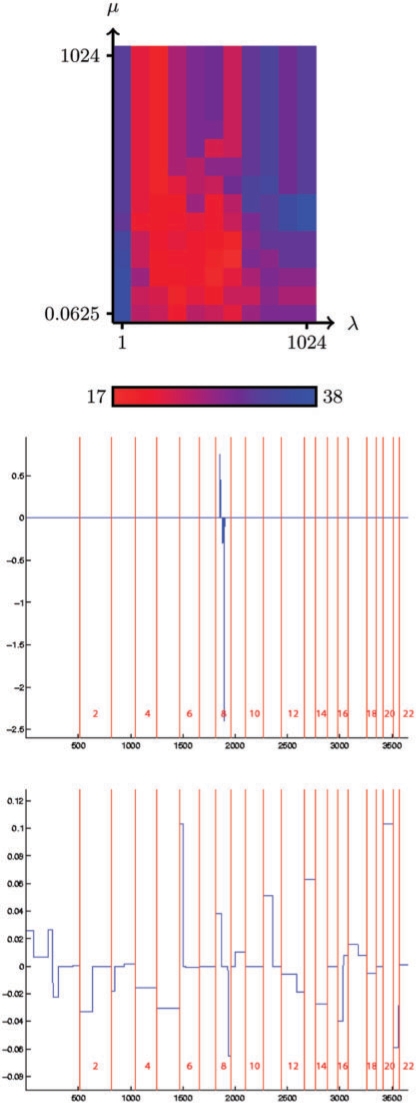
Fig. 3.
The figure on the upper part represents the number of misclassified samples in a 10-fold error loop on the melanoma dataset. The weights of the best classifier, for classical L1-SVM (middle) and for fused SVM (lower part) are ordered and represented in a blue line, annotated with the chromosome separation (red line).

