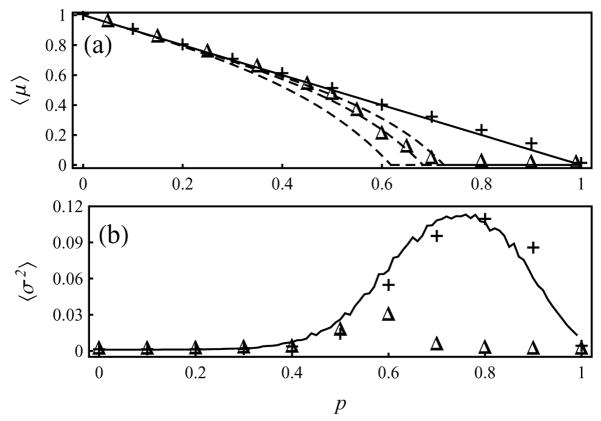
FIG. 2.
(a) The mean fraction of ON nodes. The + and Δ symbols correspond to S1 and S2, respectively. The solid line μ = 1 − p is the prediction for an infinite random Boolean network with a fraction p of NIF gates and 1 − p of OR gates. The dashed curves show the theoretical results discussed in the text. (b) The total variance corresponding to the systems in (a). The solid curve is the average variance from simulations of the Boolean model.

