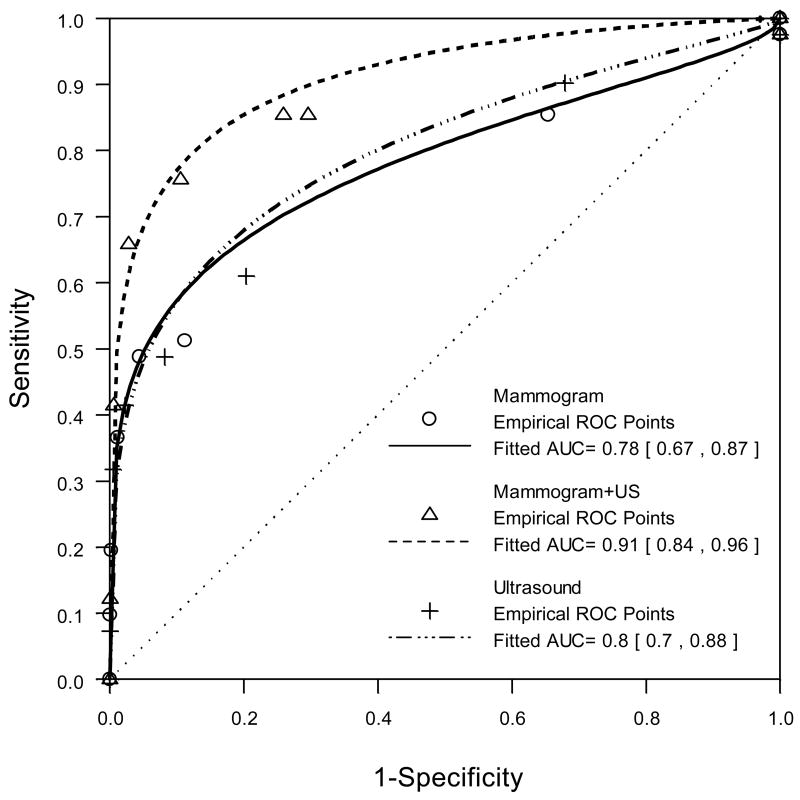
Fig. 2.
ROC curves based on expanded BI-RADS assessments for mammography alone (solid line), combined mammography and ultrasound (dashed line), and ultrasound alone (dashed and dotted line). Table 2 presents summary statistics for these curves. The ultrasound ROC is included for completeness; the study was not designed to permit direct comparison to ultrasound alone.

