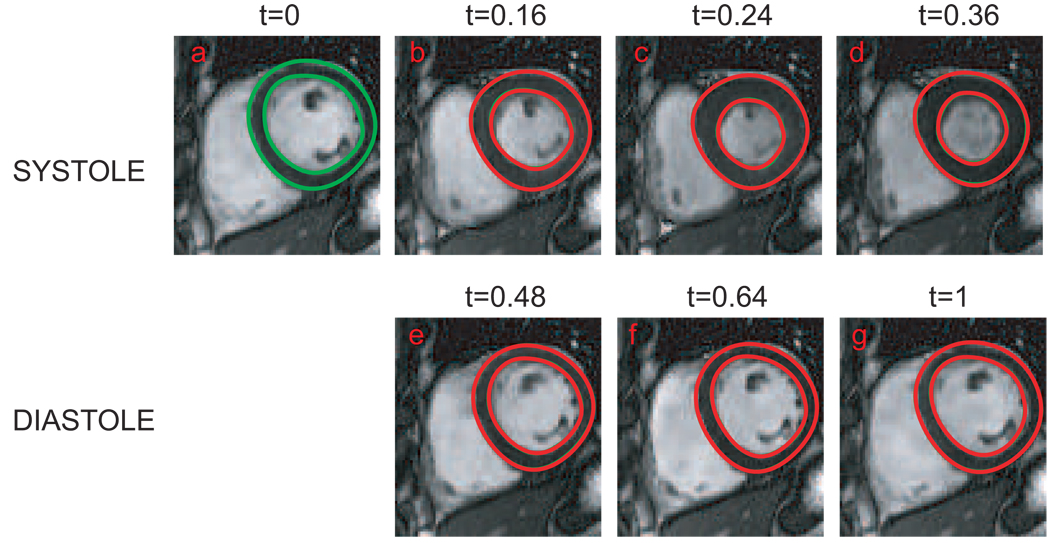
FIG. 2.
A coronal section of the left ventricle was selected from the systole phase (panels (a–d)) and the diastole phase (panels (e–g)) during one cardiac cycle. Green curves on each panel ar the automatically segmented contours of endocardium and epicardium. Red curves on each panel are the deformed template at each phase. Red and green contours are overlapped very well, which indicates the accuracy of the TS-LDDMM algorithm. The time normalized into the range between 0 and 1 is indicated on the top of each panel.

