FIG. 5.
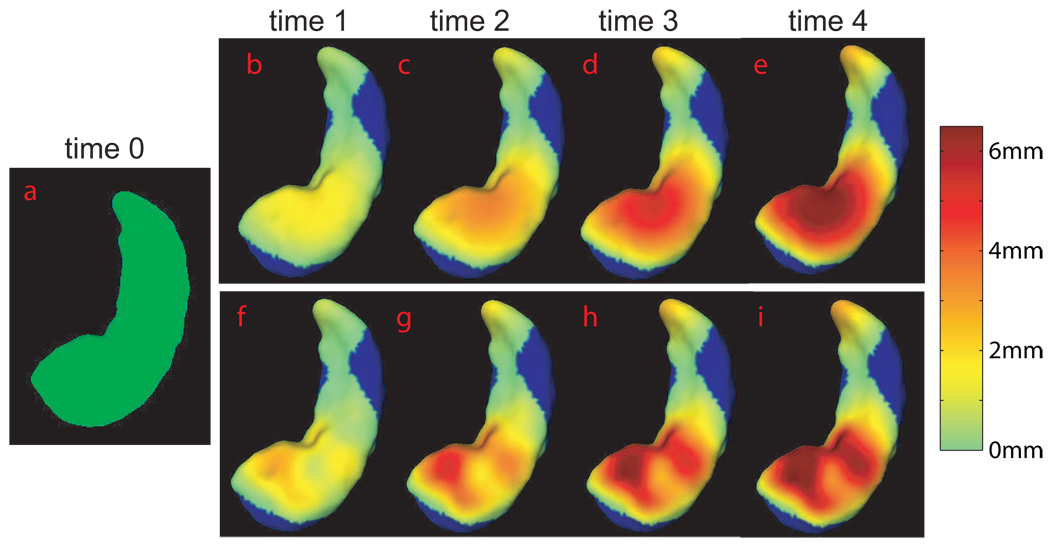
Panel (a) shows the hippocampal surface at time 0 in the superior view. Panels (b–e) illustrate the hippocampal surfaces with surface-inward deformation in the subfields of CA1,2,3 at times 1–4. The strength of the deformation is denoted by its distance to the hippocampal surface at time 0. Panels (f–i) show the deformed template computed from the TS-LDDMM algorithm at each time point . They are colored by their distances to the surface on panel (a). The region with no deformation is colored in blue.

