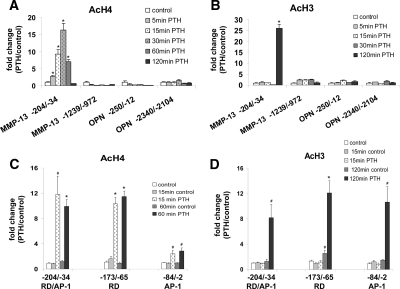
Figure 2.
PTH-stimulated changes in histone H4 and H3 acetylation on the MMP-13 promoter. Cross-linked chromatin prepared from UMR cells, untreated or treated with rat PTH (peptide 1–34, 10−8 m) for various times, was immunoprecipitated with anti-Ac-H4 (A) or anti-Ac-H3 (B) antibodies, and protein-associated DNA was purified by reversal of cross-linking, proteinase K digestion, and phenol/chloroform extraction. ChIP assays were quantitated by real-time PCR using SYBR Green fluorescence and the primers for the promoter regions indicated. Comparison of histone H4 (C) and H3 acetylation (D) levels of the RD/Runx site and of the AP-1 site of MMP-13 promoter. UMR cells, controls at 0, 15, 60, and 120 min and treated with rat PTH (peptide 1–34, 10−8 m) for 15, 60, or 120 min were used for ChIP assays. The primers used for real-time PCR were from MMP-13 proximal promoter regions: primer −204/−34 amplified both the RD site and the AP-1 site, −173/−65 was specific for the RD site, −84/−2 was specific for the AP-1 site. ΔCT values were CT values of sample, normalized with input, minus the normalized CT value from PCR of the sample with β-actin primers, and ΔΔCT values represented the difference between ΔCT of sample and ΔCT of control. ΔCT values were converted to fold change over control by raising 2 to ΔΔCT power. Error bars represent the sd of three independent experiments. # and * , P < 0.005 and P < 0.001 compared with their control samples, respectively. Ac, Acetylated; OPN, osteopontin.

