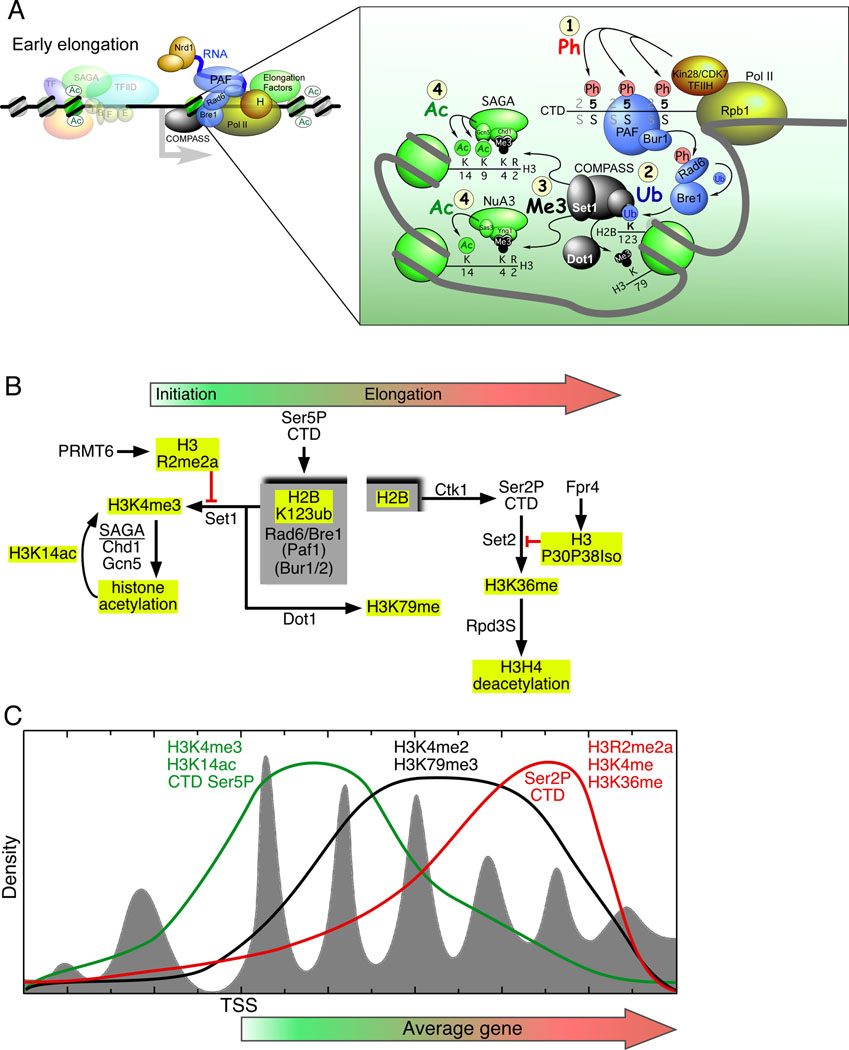
Figure 7. Histone crosstalk and the distribution of post-translational modifications across genes.
(A) Model for early elongation. Early elongation includes promoter proximal pausing, elongation factors bound to the CTD, and a cascade of histone modifications (shown in the inset and numbered 1–4). Abbreviations include: Ph, phosphorylation; Ub, ubiquitylation; Me3, trimethylation; Ac, acetylation. See text for an explanation of the model.
(B) Post-translational modification network. At the hub of this histone modification network is a cycle of ubiquitylation and deubiquitylation on histone H2B, demarcated in the gray boxes. Solid arrows and red lines connect the interdependencies of post-translational modifications. The red line indicates that a particular modification blocks the subsequent modification. Histone tail modifications are highlighted with yellow boxes. Marks generally associated with initiation are shown toward the left, whereas modifications linked to elongation are shown toward the right (with the exception of H3R2me2a, which occurs during elongation to block H3K4me3), as designated by the filled arrow at the top of the panel.
(C) Model for the distributions of histone modifications and phosphorylation of the Pol II CTD in relation to gene length. The nucleosome distribution relative to the TSS is shown in gray fill. The green, black, and red traces model the genome-wide distribution of the indicated histone modifications and CTD phosphorylation state.

