
Figure 1.
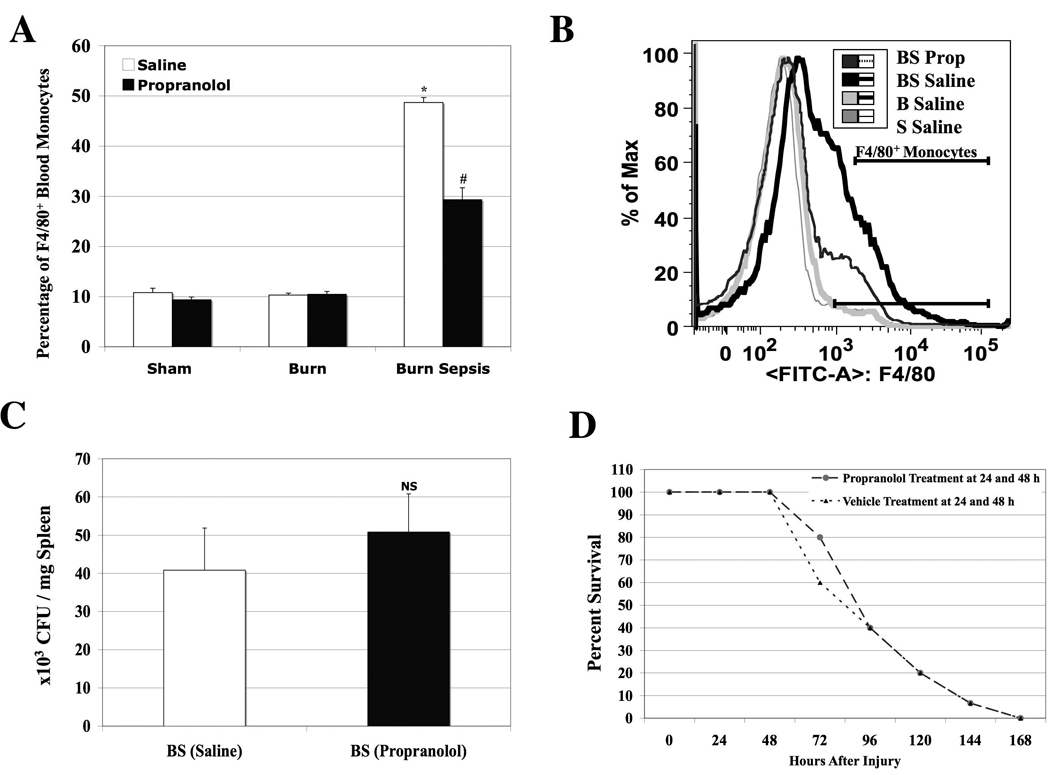
Panel A: A bar graph illustrating the MFI of total F4/80+ monocytes in blood isolated at 72h from sham (S), burn (B) and burn sepsis (BS) animals with (Black bars) or without beta-blockade (Open bars). Percentage of F4/80+ monocytes in circulation was significantly increased in BS with saline treatment; * p<0.05 vs. S and B whereas, beta -blockade significantly reduced the percentage of F4/80+ monocytes in BS (29±4% vs. 45 ± 0.8%; # p<0.05). n=6. Panel B: A representative histogram illustrating the MFI of total F4/80+ monocytes on the X-axis and number of cells on the Y-axis. Panel C: Bar graph illustrating CFU’s of Pseudomonas aerugenosa per mg spleen from saline or propranolol treated BS animals from quantitative cultures. NS: Not significant. n=6. Panel D: Percentage of surviving animals followed up to 168 hours after BS with saline or propranolol treatments at 24 and 48 hours after injury. There were no significant changes in overall survival between the treatment groups. Sham and burn groups did not have any mortalities. n =15.