
Fig 5.
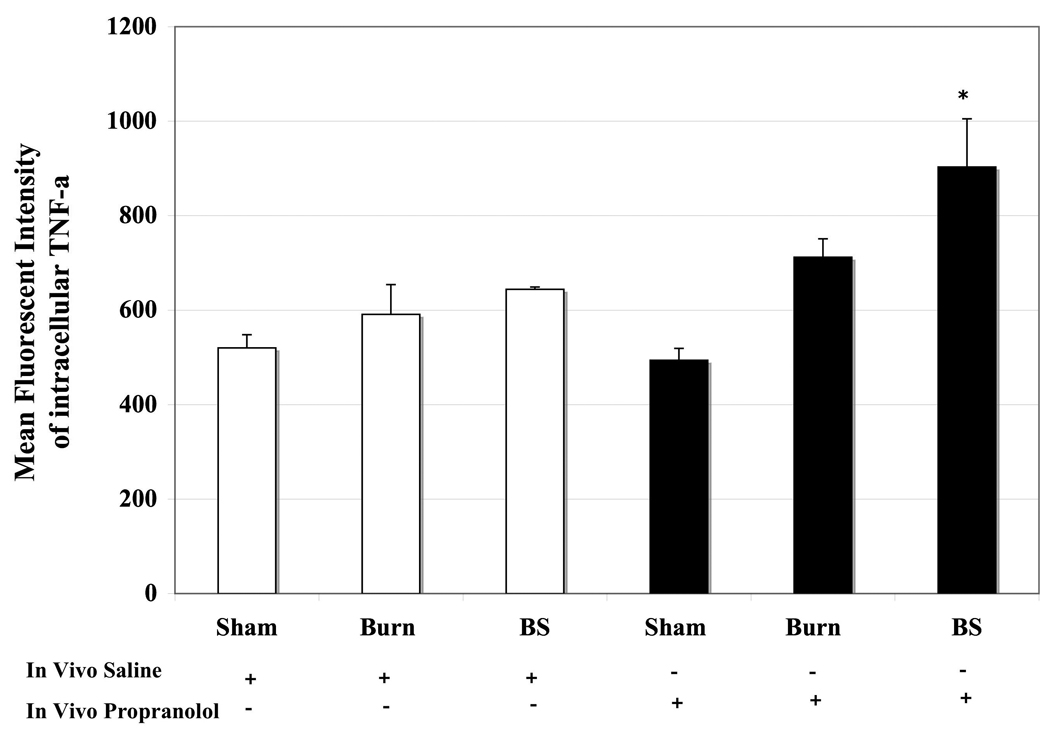
Bar graphs denoting MFI of intracellular TNF-α produced per granulocyte from peripheral blood of sham (S), burn (B) and burn sepsis (BS) animals. The first half represents saline treatment and the other half shows the result of beta-blockade. Propranolol augments TNF-α production in circulating Gr1+ granulocytes in BS group. * vs. BS saline; p<0.05. n = 4 in S and B, n=6 in BS.