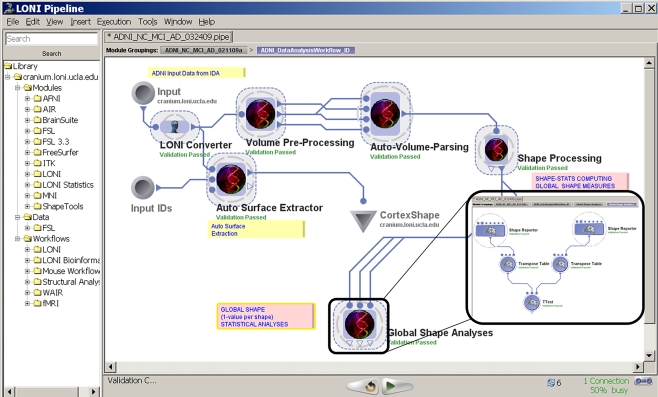
Figure 4.
An Alzheimer's Disease (AD) Pipeline workflow. The left-panel contains some predefined Pipeline module definitions including some complete workflows. The central-panel shows the main six steps of the data analysis – data conversion, pre-processing, automated extraction of regions of interest, shape processing, global shape analysis and automated cortical surface extraction. Each of these steps is itself a nested collection of modules, a pipeline, which contains a series of processing steps. The insert-figure illustrates the 3-level deep nested processing part of the Global Shape Analysis node (see the top-level tabs of the insert).

