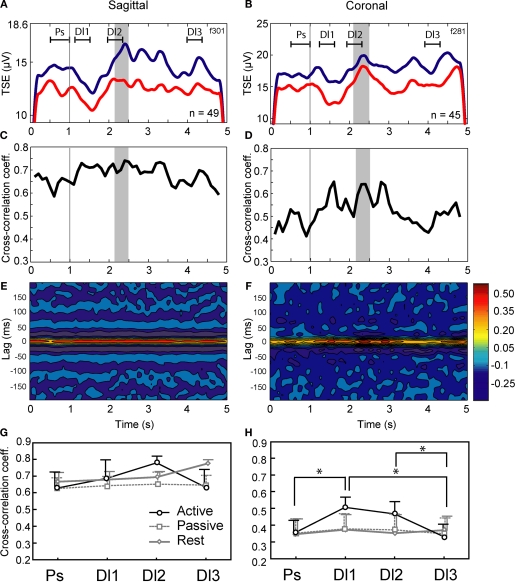
Figure 3.
Modulation of cerebellar LFP oscillations and synchronization of LFPs in the active condition, for a sagittal pair and a coronal pair. (A,B) Modulation of the 10–25 Hz oscillations across the trial, as shown by the temporal spectral evolution (TSE). Grey area: reward window, vertical line, stimulus onset. Line colors: A. blue-anterior, red-posterior; B. blue-medial, red-lateral. The different delays Ps, Dl1, Dl2, and Dl3 are indicated. (C,D) Cross-correlation coefficients for the same experiments. (E,F) Cross-correlogram for the same experiments (abscissa: time in the trial; ordinate: lag; color: height in the correlogram). Parts A to F: typical results illustrated by data recorded in monkey F. (G,H) Cross-correlation of LFPs in all conditions (active, passive, and rest), for each delay (Ps, Dl1, Dl2, and Dl3), for both monkeys F and K. Means and s.e.m. indicated; *p < 0.05 (Tukey post-hoc) of this value (active condition) vs. other active condition delays, and passive and rest conditions.

