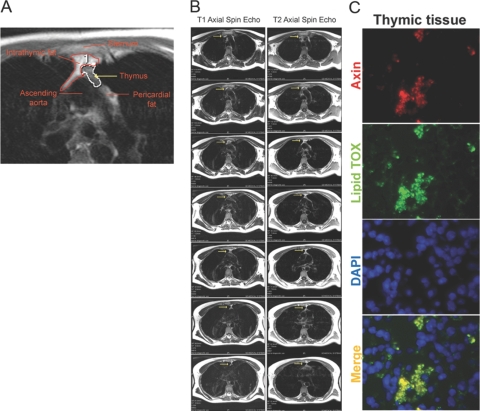
Fig. 1.
Adipocyte accumulation in the thymic microenvironment. (A) The region of interest (ROI) depicting the thymus from a representative 45-year-old healthy male (n=12) is highlighted. The fat in the thymus appears as the hyperintense region highlighted with a red line within the ROI. The white outline region shows the lymphoid tissue within the thymic space. (B) The T1 and T2 spin echo axial MRI sequences above the tracheal bifurcation area. The thymus is highlighted with yellow arrows. (C) The immunoflourescent staining showing colocalization of axin (red) in lipid-expressing cells (LipidTOX, green) in the thymus of a representative 18-month-old mouse (n=4). DAPI, 4′,6-Diamidino-2-phenylindole.

