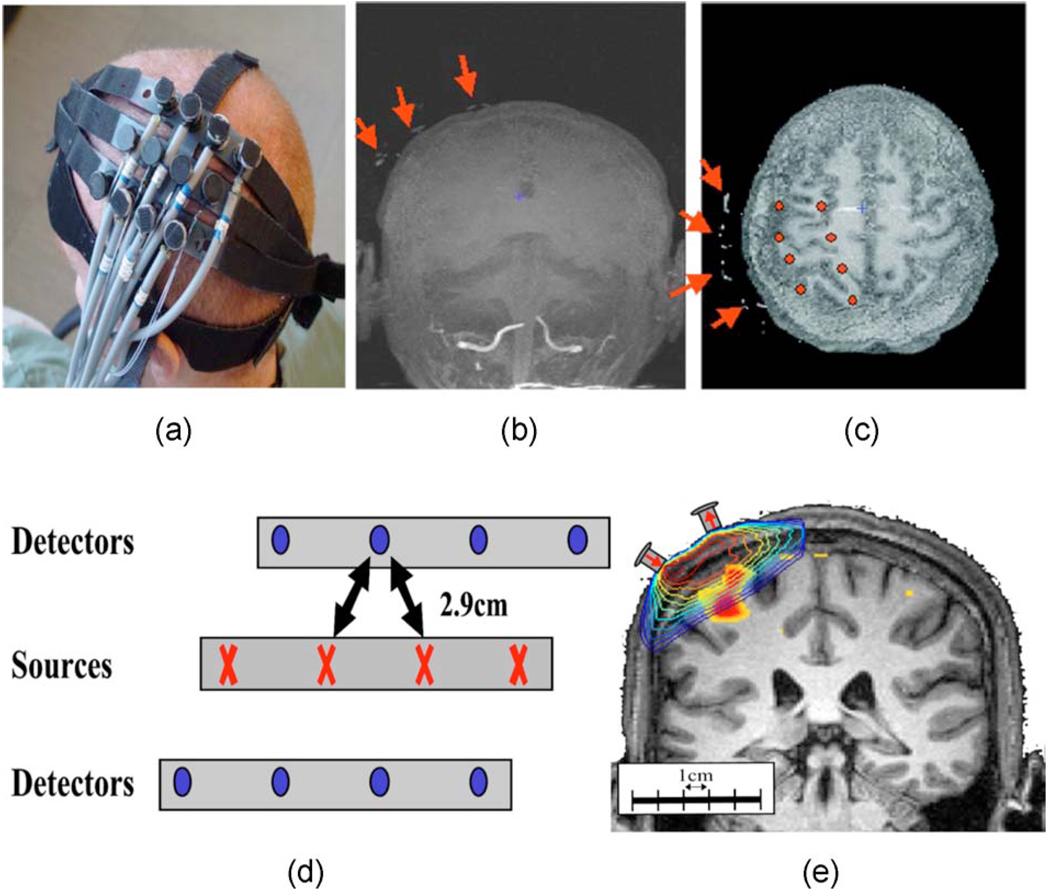
Fig. 3. Diffuse optical tomography.
Diffuse optical tomography uses spectroscopic measurements of optical absorption changes to record hemoglobin concentration changes. (a) The optical probe was placed over the subject’s primary motor area. (d) The probe contained four source and eight detector positions spaced 2.9 cm apart. (b) and (c) Fiducial markers on the probe were visible in the anatomical MR images. (e) The position of the probe and a segmented layer model for each subject were used to generate the optical sensitivity profiles using Monte Carlo methods.

