Figure 2.
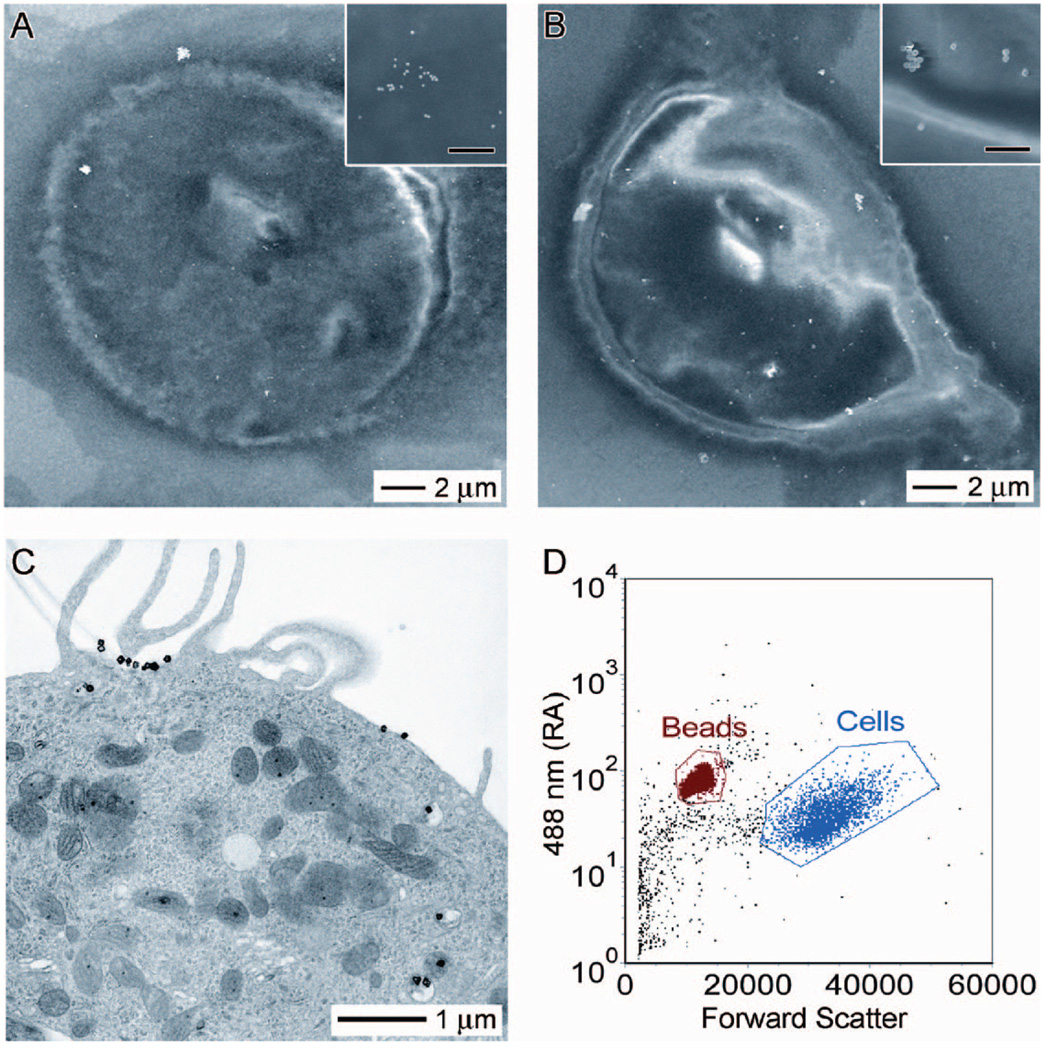
SEM images of SK-BR-3 cells targeted with immuno Au nanospheres (A) and nanocages (B). SEM images at higher magnification (insets) reveal that the bright spots in the SEM images are indeed nanospheres and nanocages, respectively. The scale bar in the insets represents 500 nm. (C) TEM image of a microtomed SK-BR-3 cell conjugated with immuno Au nanocages. In addition to immuno Au nanocages decorating the surface of the cell, this microtomed TEM image reveals that some immuno Au nanocages are internalized by the cell. However, they do not appear to enter the nucleus. (D) Typical flow cytometry graph indicating how the forward scatter (x-axis) and right angle scatter (y-axis) can be used to differentiate the size difference between beads and cells. As the concentration of beads is known for a given sample, it provides an internal reference for measuring the concentration of cells; when these data are coupled with ICP-MS analysis for Au, the number of immuno Au nanocages per cell can be estimated.

