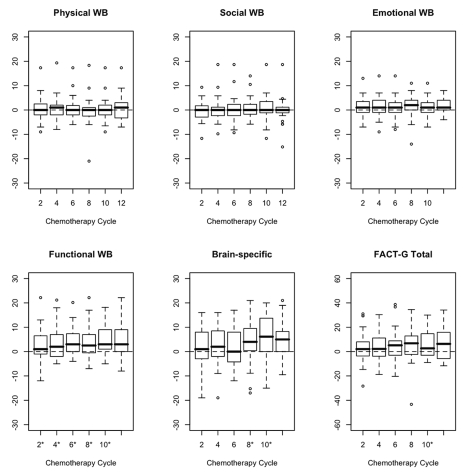
Fig. 1.
Box plots of the change score at each chemotherapy cycle compared to baseline for five realms of quality of life and Functional Assessment of Cancer Therapy–General (FACT-G). Abbreviation: WB, well-being. Asterisks indicate cycles for which p-values based on the paired t-test are statistically significant (p<0.01). Note: The values within the box represent the lower quartile (Q1), median, and the upper quartile (Q3) of the distribution. The horizontal bars at the two ends are the smallest and largest non-outlier observations. The circles beyond the horizontal bars represent outlying cases, defined as 1.5 times the interquartile range (Q3–Q1), below Q1 or above Q3.

