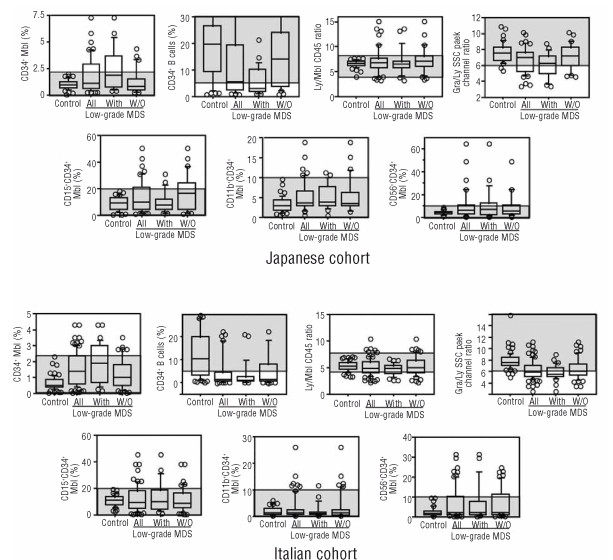
Figure 2.
Analysis of seven flow cytometry parameters in the prospective cohorts. The horizontal lines in each boxplot represent the 90th, 75th, 50th, 25th, and 10th percentiles. Circles are outliers. Controls are nonclonal cytopenic patients. “All” indicates all low-grade myelodysplastic syndromes (MDS) patients, “With” indicates low-grade MDS with conventional markers, and “W/O” indicates low-grade MDS without conventional markers. Shaded areas are the predetermined reference ranges.

