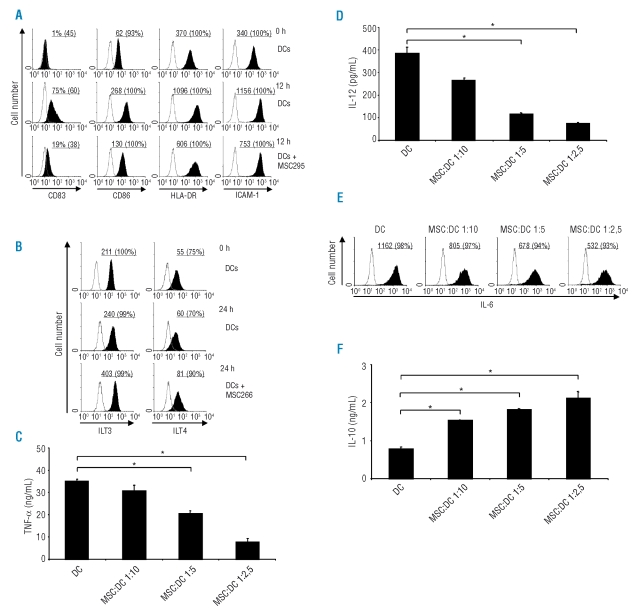
Figure 1.
Impact of Mesenchymal stem cells (MSCs) on maturation and cytokine production of slanDCs. (A) SlanDCs were maintained in the presence or absence of MSCs for 12 h. Subsequently, expression levels of CD83, CD86, HLA-DR and ICAM-1 at the surface of slanDCs were determined by flow cytometry. The results of one representative MSC line out of three performed with similar results are depicted. Values represent the MFI and percentage of cells staining positive for each surface molecule (filled) compared to the respective isotype control (empty). (B) SlanDCs were coincubated with or without MSCs for 24 h. Then, expression levels of ILT3 and ILT4 on slanDCs were analyzed by flow cytometry. The results of one representative MSC line out of three performed with similar results are demonstrated. Values represent the MFI and percentage of cells staining positive for each surface molecule (filled) compared to the respective isotype control (empty). (C-F) SlanDCs were cultivated with MSCs at different MSC-DC ratios (1:2,5, 1:5, 1:10). After 6 h, DCs were stimulated with LPS for an additional 18 h. Supernatants were collected and concentration of TNF-α, IL-12 and IL-10 was analyzed by ELISA. Intracellular IL-6 expression of slanDCs was determined by flow cytometry. The results of one representative MSC line out of three different MSC lines performed with similar results are demonstrated. (C, D, F) Values represent the mean ± SE of triplicate samples. Asterisks indicate a statistically significant difference. (E) Values represent the MFI and percentage of cells staining positive for IL-6 (filled) compared to the respective isotype control (empty).

