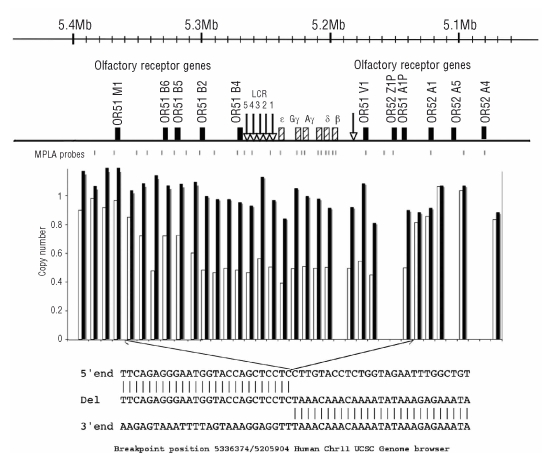
Figure 1.
Diagram to illustrate the structure of the β globin gene cluster and its surroundings together with the positions of all the MPLA probes used in the analysis. Below are the results of the relevant MLPA probes on the mother (black bars) and the propositus (white bars); note the 5’ end of the deletion was clearer on other MLPA analyses of both the propositus and her father. Bottom: the sequence of the junction fragment.

