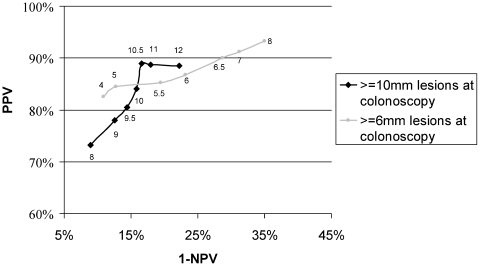
Figure 2.
Plot of the positive predictive value (PPV) versus the negative predictive value (NPV) when using different cut-off sizes for CT colonography (CTC) for detection of true colonoscopy lesions of ⩾10 mm and ⩾6 mm. The curve shows a plot of PPV versus 1–NPV. Results for detection of patients with lesions on colonoscopy of ⩾10 mm, for cut-off sizes for CTC lesions of ⩾8, 9, 9.5, 10, 10.5, 11 and 12 mm are shown. Results for detection of lesions of ⩾6 mm are shown for CTC cut-off sizes of 4, 5, 5.5, 6, 6.5, 7 and 8 mm.

