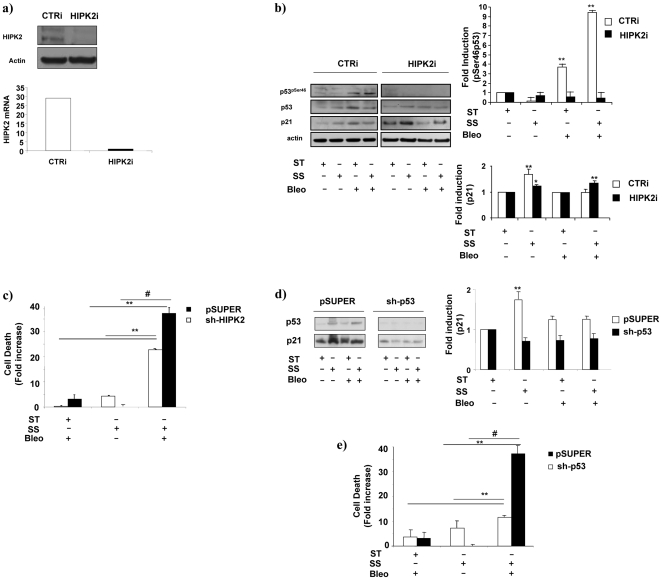
Figure 4. HIPK2 or p53 knock-down influence SS-dependent effects on endothelial cells cultured in the presence of Bleo.
HUVEC interfered for HIPK2 or p53 expression were treated for 4 or 16 h with Bleo (10 ug/ml) in static condition ST or exposed to SS. a) The left panel shows a representative western blotting analysis performed in HUVEC transfected with HIPK2 short interfering oligos (HIPK2i) or scrambled controls (CTRi). HIPK2 and actin levels are indicated on the left. The right panel shows the real-time PCR determination of the specific HIPK2 RNA content in CTRi (open bar) or HIPK2i cells (black bars). b) The picture depicts a representative western blotting analysis showing p53 phosphorylation on serine 46 (p53pSer46) in cells transfected with scrambled (CTRi) or HIPK2 interfering oligos (HIPK2i). p21waf1,cip1,sdi1 expression levels (p21) were evaluated in all the conditions tested. Cells were analysed in static culture (ST), in the presence of laminar flow (SS) with of without Bleo (B). Total p53 and actin content is indicated on the left. The upper and lower graphs on the right show an average densitometric analysis of p53 phosphorylation in serine 46 and p21waf1,cip1,sdi1 expression respectively as determined in CTRi (open bars) or in HIPK2i (black bars). Data, obtained from three independent experiments, are expressed in arbitrary units. ** = p<0.01. c) The graphs shows the results of three independent experiments aimed at determining survival in control (pSUPER) or HIPK2 interfered cells (sh-HIPK2). The average data of three independent experiments were generated by propidium iodide staining and FACS analysis after 16 h of static culture (ST), laminar flow exposure (SS) with or without Bleo (B). ** = p<0.01. # = p<0.03. d) The picture shows the expression level of p53 and p21waf1,cip1,sdi1 determined by western blotting in cells infected with the control (pSUPER) the p53 (sh-p53) or the HIPK2 (sh-HIPK2) interfering retroviruses. Data were generated from cell cultured on static culture (ST), exposed to laminar flow (SS) with or without Bleo (B). P53 (p53) and p21waf1,cip1,sdi1 (p21) bands are indicated on the left. The lower graph depicts the average densitometric analysis of p21waf1,cip1,sdi1 levels determined in three independent experiments. pSUPER, open bars, sh-p53 black bars, sh-HIPK2 (striped bars). ** = p<0.01. e) The graphs shows the results of three independent experiments aimed at determining survival in control (pSUPER) or p53 interfered cells (sh-p53). The average data of three independent experiments were generated by propidium iodide staining and FACS analysis after 16 h of static culture (ST), laminar flow exposure (SS) with or without Bleo (B). ** = p<0.01. # = p<0.03.

