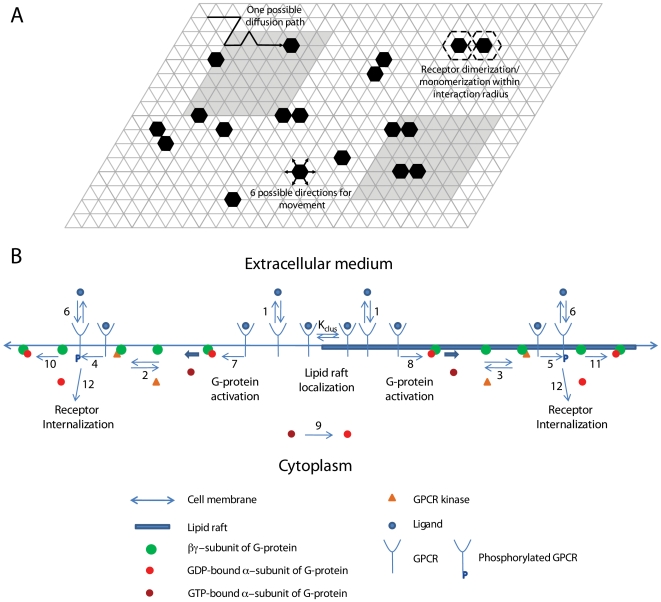
Figure 2. Schematic representation of the structure of (A) the Monte Carlo model of receptor dimerization and localization and a section of the lattice simulating the cell membrane, and (B) the ODE model of G-protein coupled receptor signaling.
Black hexagons and gray squares in (A) represent receptors and lipid rafts, respectively. One lattice spacing here is equivalent to 10 real simulation lattice spacings. The ODE model shown in (B) includes ligand binding, ligand-induced lipid raft partitioning of receptors, G-protein activation by receptor-ligand complex, receptor phosphorylation by GPCR kinase, and receptor internalization. Numbers represent model reactions as listed in Table 2. Clustering equilibrium constant Kclus is determined by MC simulations and characterizes receptor enrichment in lipid rafts.

