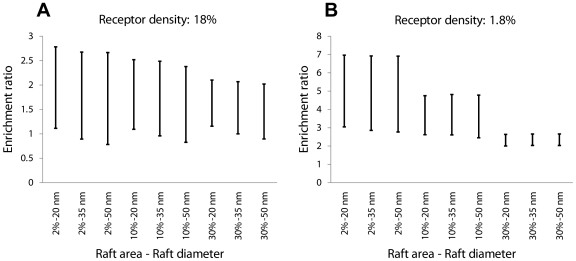
Figure 4. Predicted variation in the enrichment ratio with kmono and kdimer as a function of the total area (as a percentage of the cell membrane area) and diameter of lipid rafts.
Results are shown for receptor densities of (A) 18% and (B) 1.8% of the cell surface area. For each pair of raft diameter and raft coverage, kmono and kdimer are varied from 104 to 107 s−1 so as to include monomer, dimer and oligomer regimes. Diffusion coefficients in lipid raft and non-raft regions are 10−11 cm2/s and 10−10 cm2/s respectively.

