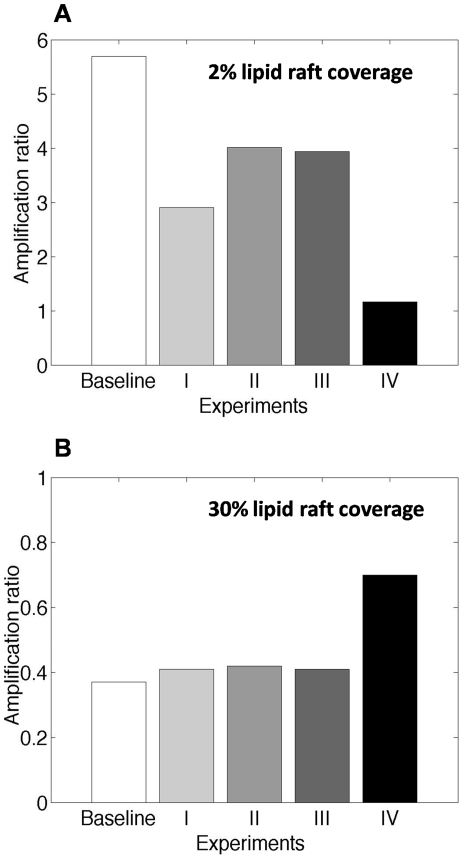
Figure 8. Simulation results for proposed experimental protocols for (A) amplification of G-protein signaling in the presence of lipid rafts with 2% coverage, and (B) attenuation of G-protein signaling in the presence of lipid rafts with 30% coverage.
Baseline experiments are performed using khyd = 10 s−1, Rtot = 50,000 #/cell and [L] = 0.1Kd. The effects of a change in a single parameter are shown by experiments I-III (experiment I∶khyd = 1 s−1, experiment II∶Rtot = 250,000 #/cell and experiment III∶[L] = Kd). The effect of a simultaneous change in all three parameters is shown by experiment IV (khyd = 1 s−1, Rtot = 250,000 #/cell and [L] = Kd). The greatest enrichment ratio for ligand-bound receptors predicted by MC model was used in each simulation. Other parameter values are as listed in Table 1.

