|
Reaction species
|
|
L
|
Ligand |
Gclus
|
Trimeric G-protein in the raft region |
|
R
|
G-protein coupled receptor |
(βγ)clus
|
βγ-subunit of G-protein in the raft region |
|
LR
|
Ligand/receptor complex |
RK
|
GPCR kinase |
|
LRscat
|
Ligand/receptor complex in the non-raft region |
LR-P
|
Phosphorylated ligand-bound receptor |
|
LRclus
|
Ligand/receptor complex in the raft region |
R-P
|
Phosphorylated receptor |
|
Gscat
|
Trimeric G-protein in the non-raft region |
LRi
|
Internalized ligand-bound receptor |
|
α-GTP
|
GTP-bound (active) α-subunit of G-protein |
α-GDP
|
GDP-bound α-subunit of G-protein |
|
(βγ)scat
|
βγ-subunit of G-protein in the non-raft region |
|
|
|
ODE model reactions and flux expressions
|
| 1 |
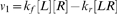
L+R ↔ LR |
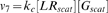
7 |
[LRscat]∶Gscat → α−GTP+βγscat
|
|
|
|
|
| 2 |
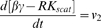
βγscat+RK ↔ βγ−RKscat
|
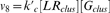
8 |
[LRclus]∶Gclus → α−GTP+βγclus
|
|

|
|
|
| 3 |
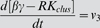
βγclus+RK ↔ βγ−RKclus
|
9 |
α−GTP → α-GDP |
|

|
|

|
| 4 |
[βγ−RKscat]∶LRscat → LR−Pscat
|
10 |
α−GDP+βγscat → Gscat
|
|

|
|

|
| 5 |
[βγ−RKclus]∶LRclus → LR−Pclus
|
11 |
α−GDP+βγclus → Gclus
|
|

|
|

|
| 6 |
L+R−P ↔ LR−P |
12 |
LR−P → LRi
|
|

|
|

|
|
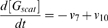
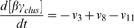
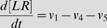
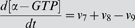
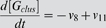
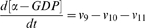
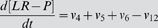
ODE model equations
|

|
|
|
|
|
|
|
|

|
|

|
|

|

|
|

|

|
|
