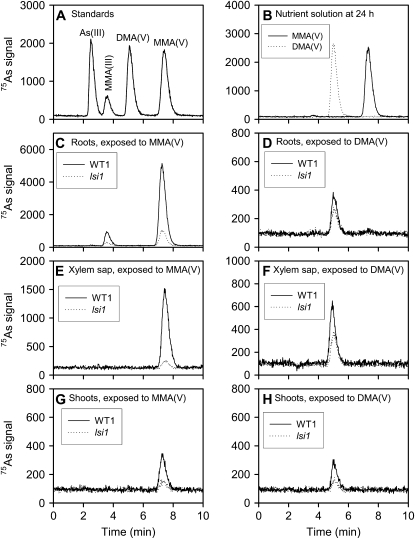
Figure 1.
As speciation using HPLC-ICP-MS. Rice plants were exposed to 5 μm MMA(V) or DMA(V) for 24 h. A, Chromatogram of standards containing 25 ng As L−1 of As(III), MMA(V), and DMA(V) and 7.5 ng As L−1 MMA(III). B, Nutrient solutions after 24 h exposure. C and D, Root extracts of the wild type and lsi1 mutant exposed to MMA(V) (C) or DMA(V) (D). E and F, Xylem sap collected from the wild type and lsi1 mutant exposed to MMA(V) (E) or DMA(V) (F). G and H, Shoot extracts of the wild type and lsi1 mutant exposed to MMA(V) (G) or DMA(V) (H). 75As signal was normalized by the signal of the internal standard 72Ge.

