Figure 2.
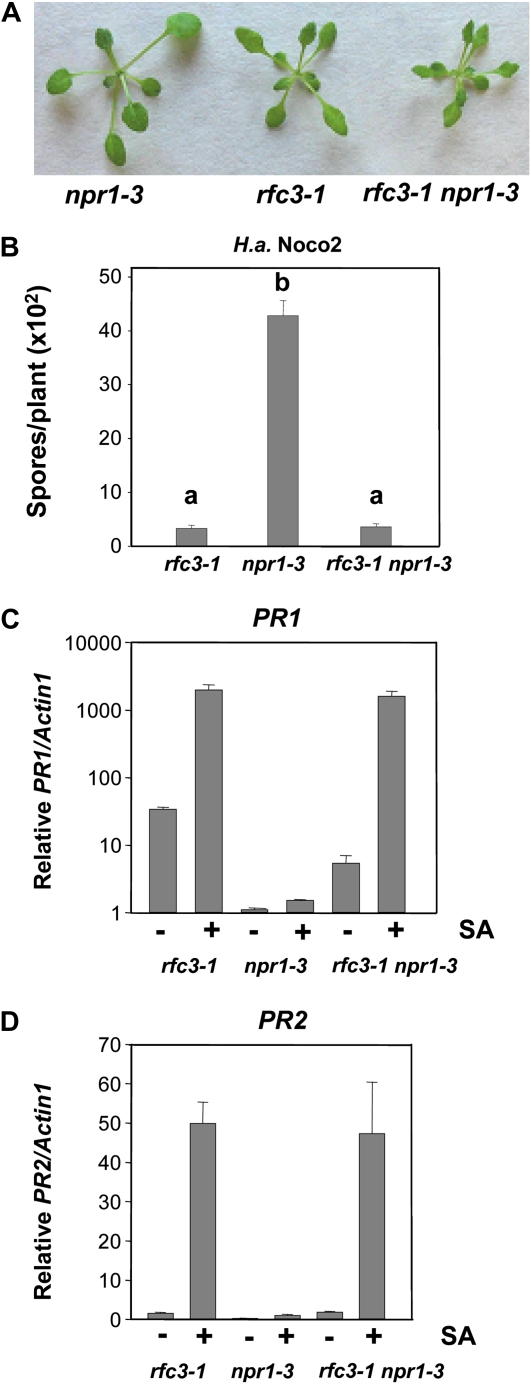
Enhanced pathogen resistance and PR gene expression in the rfc3-1 npr1-3 double mutant. A, Morphology of npr1-3, rfc3-1, and rfc3-1 npr1-3 plants. All plants were grown on soil and photographed when they were 4 weeks old. B, Growth of H. a. Noco2 on npr1-3, rfc3-1, and rfc3-1 npr1-3 plants. The experiment was carried out as described in Figure 1E. Statistical differences among the samples are labeled with different letters (P < 0.01, ANOVA). The experiment was repeated three times with similar results. C and D, PR1 (C) and PR2 (D) expression in npr1-3, rfc3-1, and rfc3-1 npr1-3 plants with or without SA induction. The experiment was carried out as described in Figure 1C. PR1 and PR2 expression of rfc3-1 or rfc3-1 npr1-3 is significantly higher than that of npr1-3, with or without SA (P < 0.01, t test). There is no significant difference in PR1 or PR2 expression between rfc3-1 and rfc3-1 npr1-3 upon SA induction (P > 0.05). The experiments were repeated once with similar results. [See online article for color version of this figure.]

