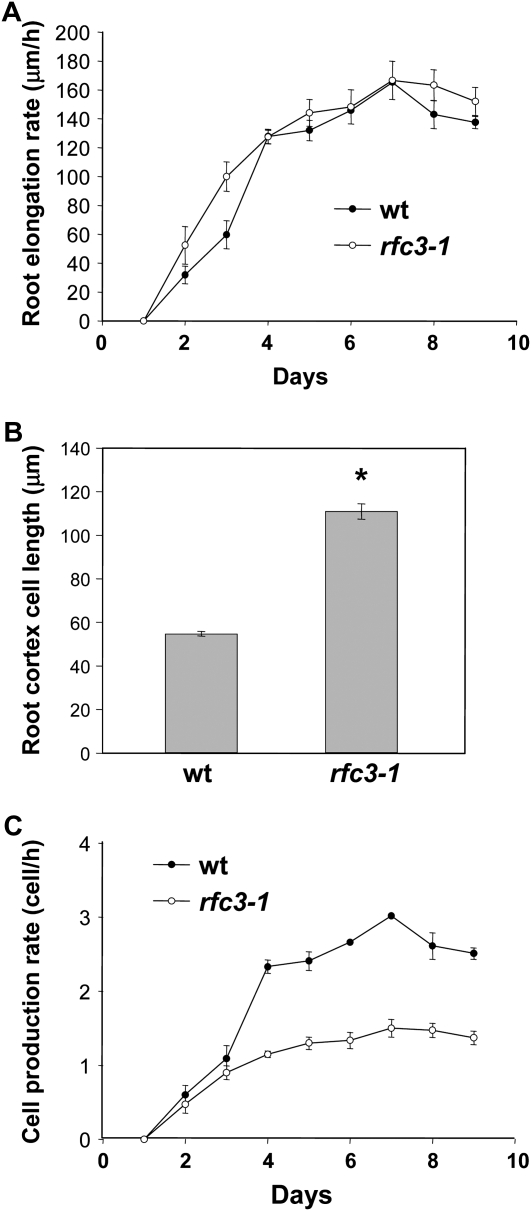
Figure 6.
Root growth and cell production in the wild type (wt) and the rfc3-1 mutant. A, Root elongation rate in wild-type and rfc3-1 seedlings. The values presented are averages of 30 replicates ± sd. Statistical analyses of root elongation rates of rfc3-1 compared with Col on each date revealed no statistically significant difference (P > 0.05, t test). B, Root cortex cell length in the root hair zone of wild-type and rfc3-1 plants. The values presented are averages of 50 replicates ± sd. The root cortex cell length of rfc3-1 is significantly longer than that of the Col wild type (P < 0.01, t test). C, Cell production rate (root elongation rate/root cortex cell length) of wild-type and rfc3-1 plants. Statistical analyses of cell production rates of rfc3-1 compared with Col on each date revealed statistically significant differences except for values at days 1, 2, and 3 (P < 0.01, t test).

