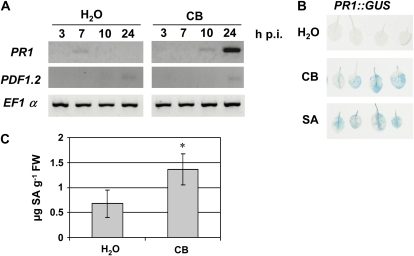
Figure 1.
PR1 gene expression and SA production in Arabidopsis leaves following CB treatment. A, Expression patterns of PR1 (SA pathway) and PDF1.2 (ET/JA pathway) were monitored by RT-PCR using RNAs extracted from Col-0 leaves at the indicated times after infiltration of distilled water or CB. The constitutive EF1α gene was used as a control. B, GUS staining of leaves from transgenic PR1::GUS plants 24 h after infiltration of water, CB, or SA. C, Total SA content was measured by HPLC in Col-0 leaves 24 h after the indicated treatments (μg SA g−1 fresh weight [FW]). n = 6, error bars indicate sd, and the asterisk indicates a significant difference from the control by the Mann-Whitney test (P < 0.01).

