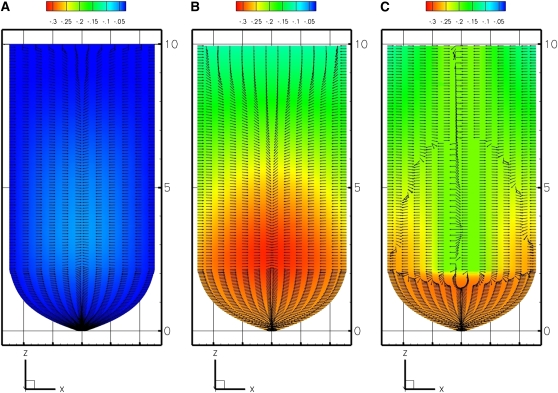
Figure 2.
Model predictions of growth-sustaining Ψ (MPa) displayed as a color or gray scale map (scale above the panels) on a median longisection through the growth zone. Direction of flux of the water pathway is denoted by arrows of equal length. A, EE model (external source, root in equilibrium with bathing medium). B, EASE model (external source, gradient at root boundary). C, PEWS model (external and phloem sources, gradient at root boundary). [See online article for color version of this figure.]

