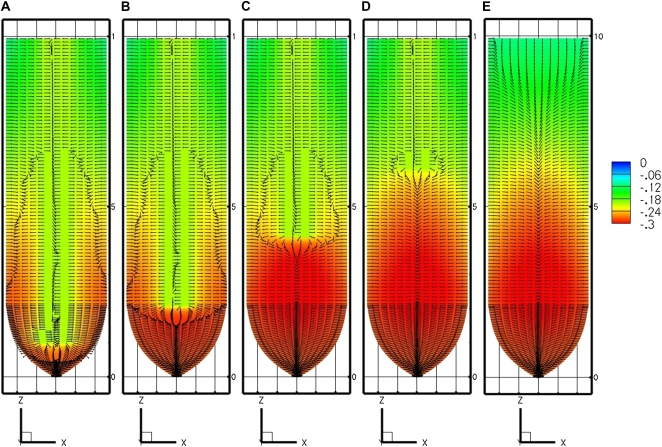
Figure 4.
Effect of the extent of internal source shown by the PEWS model with different locations for the start of the phloem source. A, Location 1 mm from tip. B, Location 2.1 mm from tip. C, Location 4.1 mm from tip. D, Location 6.1 mm from tip. E, EASE model (no phloem sources). [See online article for color version of this figure.]

