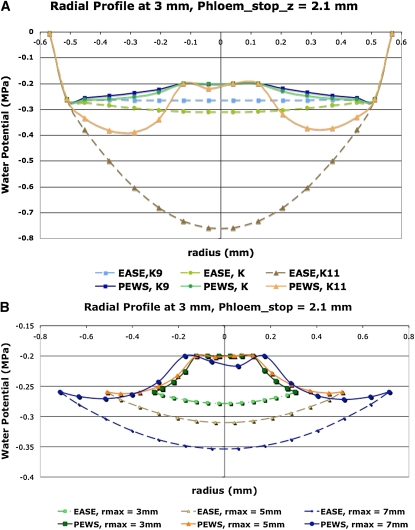
Figure 7.
Radial profiles of Ψ showing how the presence of phloem water sources produces different sensitivities to hydraulic conductivity and root radius. EASE model results are shown with dashed lines, and PEWS model results are shown with solid lines. A, Hydraulic conductivity values color coded as shown. K9 represents  . K represents
  . K11 represents
  . B, Root radius color coded as shown for 0.3, 0.5, and 0.7 mm. [See online article for color version of this figure.]

