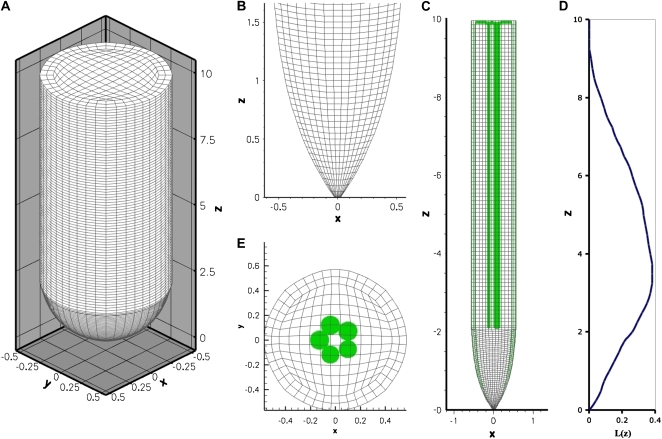
Figure 8.
The computational root grid with protophloem source grid placement. A, Three-dimensional (x, y, z) view of the root grid (not to scale). B, Two-dimensional (x, z) view of the longitudinal section for the internal parabolic grid at z = 2.0 mm. C, Two-dimensional (x, z) view of the longitudinal section for the internal radial grid with the protophloem source grid placement. D, Relative elemental growth rate values (L) shown on the z distance scale used in A and B. E, Two-dimensional radial transverse (x, y) of the modified H-grid used in modeling the internal radial grid with rmax = 0.5 mm. The protophloem sources, each with a radius of 0.07 mm, are placed asymmetrically as shown. [See online article for color version of this figure.]

