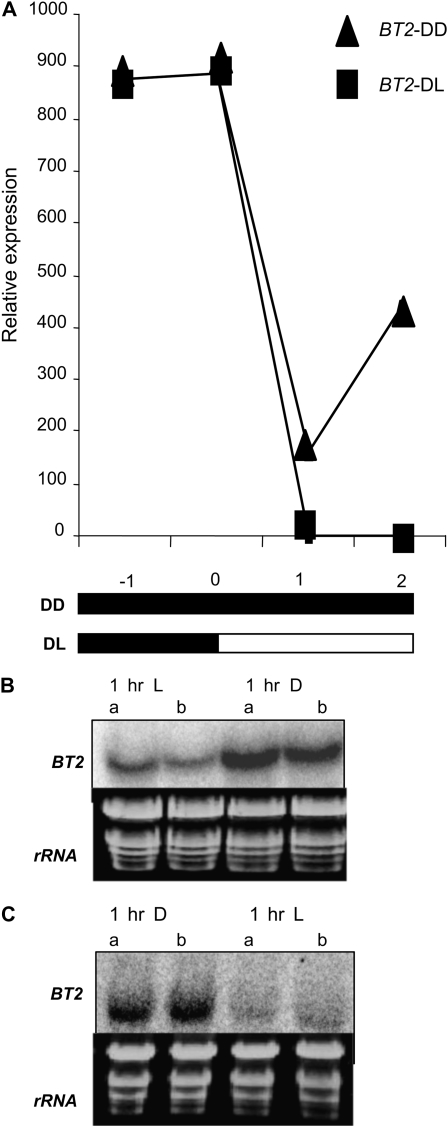
Figure 2.
Light modulates BT2 expression, independent of circadian regulation. A, After entrainment of wild-type plants to 14-h/10-h light/dark cycles for 3 weeks, plants were either held in extended darkness (DD) or transferred to light (DL). Total RNA was extracted from rosette leaves harvested at the indicated times and subjected to qRT-PCR analysis. 18S rRNA was used to normalize the qRT-PCR data, and the expression values plotted for BT2 are averages of two biological replicates. Values are relative to the minimum value, which occurred at the +1-h time point. White and black bars at the bottom represent light and dark conditions, respectively. B and C, Three-week-old wild-type plants were either exposed to 1 h of dark (D) during the middle of light phase (B) or 1 h of light (L) during the middle of dark phase (C). Rosette leaves were harvested and analyzed by RNA gel blots. The first two lanes in both blots represent controls that remained in their respective light and dark conditions. Replicate samples are indicated by a and b. Ethidium bromide-stained rRNA was used as a loading control.

