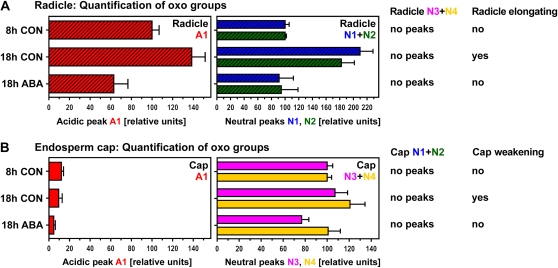
Figure 5.
Quantification of peak areas indicative of ·OH attack on polysaccharides in the radicle (A) and the endosperm cap (B). While a distinct acidic peak (A1) was only present in the radicle, neutral peaks were detected in all samples but differed qualitatively between radicles (N1 and N2; see Fig. 3) and caps (N3 and N4; see Fig. 4). N3 was identified as [3H]Ara (see Fig. 4, B and C). Areas under peaks were normalized by setting the value at 8 h to 100. The physiological state of the seeds at the time of dissection is indicated. Mean values ± se of at least four replicates (200 radicles and 1,000 caps used for extraction) are presented. CON, Control.

