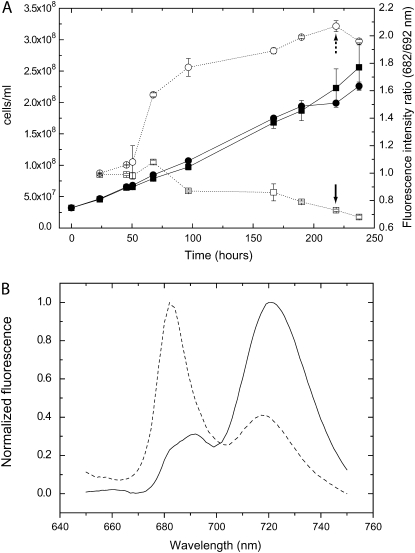
Figure 2.
Development of iron limitation in DFB-treated cells. A, Cell density (black symbols) and 77 K chlorophyll fluorescence emission spectra peak ratios (white symbols) of cultures grown in YBG11 containing 10 μm iron in the presence (circles) or absence (squares) of 50 μm DFB. Starter cultures were grown on YBG11 containing 10 μm iron. The sd was calculated from two repeats. B, Sample fluorescence spectra (collected at 218 h; marked by arrows in A). The fluorescence at 682 nm is mainly a result of the CP43′ antenna complex emission, 692 nm of PSII reaction center core emission, and 720 nm of PSI emission.

