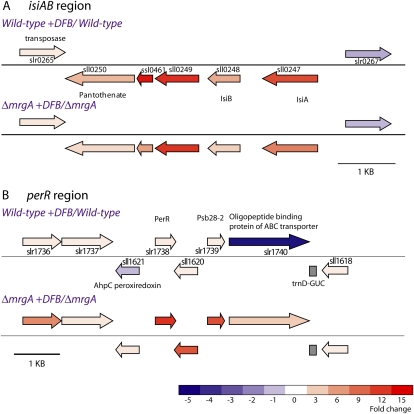
Figure 5.
A map of the iron and oxidative stress-responsive regions in the Synechocystis 6803 genome. The genomic regions surrounding the isiA (A) and perR (B) genes are depicted. The fold change in transcript level, recorded in the microarray experiment, is represented by a color scale. Results for both wild type + DFB/wild type and ΔmrgA + DFB/ΔmrgA are presented. The color scale represents fold change in transcript levels between ΔmrgA + DFB and wild type + DFB. A complete listing of the results for these open reading frames can be found in Table II and Supplemental File S1.

