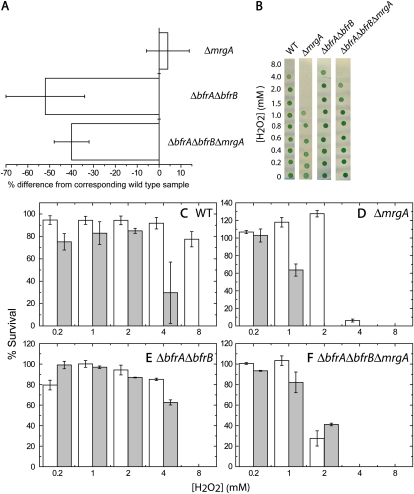
Figure 6.
Survival of cells after exposure to hydrogen peroxide (H2O2). Wild-type (WT), ΔbfrAΔbfrB, ΔmrgA, and ΔbfrAΔbfrBΔmrgA cells were grown for 7 d in YBG11 medium containing either 0.3 or 10 μm iron, washed, and adjusted to a final concentration of 7 × 10⁷ cells mL−1 in iron-free YBG11. The adjusted cultures were incubated for 20 h in the presence of 0 to 8 mm H2O2 in darkness. In order to assess viability after the H2O2 treatment, 2 μL from each treatment was spotted onto BG11 plates. The results were documented by photography, and brightness was quantified. Results are presented as percentages of the 0 mm H2O2 control. A, The relative iron quota of the mutant cells grown on sufficient iron (data for ΔbfrAΔbfrB were extracted from Keren et al., 2004). B, Samples of spot assays are shown (from cultures grown in 10 μm iron). C to F, The responses of the wild type and mutant strains to H2O2 treatment after growth in 0.3 μm (white bars) or 10 μm iron (gray bars). The data for 0.4 to 0.8 mm H2O2 were omitted for clarity. sd was derived from two biological repeats. [See online article for color version of this figure.]

