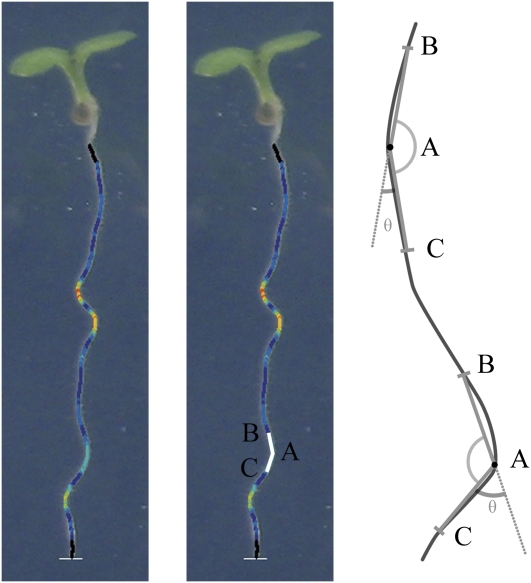
Figure 3.
Illustration of how local root angles are calculated. An angle, BAC, is measured for each point on the trace in turn, by connecting the current point (A) to two points farther up (B) and down (C) the root, as illustrated by the two lines on the center image. The colors overlaid on the root image visualize θ as calculated at each point; dark blue (small angles) through to red (large angles; high curvature). Two examples are also presented on the schematic at right. [See online article for color version of this figure.]

