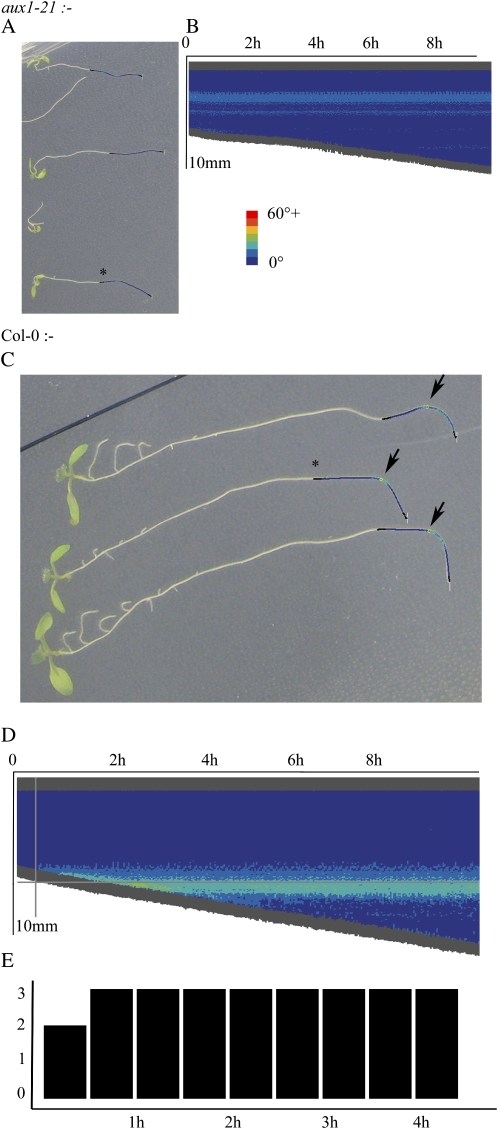
Figure 6.
A, aux1-21 roots show no gravitational response. B, Example of a curvature plot of one of the roots confirms no response. The corresponding root is marked with an asterisk in A. C, Col-0 roots show a clear response to gravity, as indicated by the arrows. D, A Col-0 root shows a gravitational response in the curvature chart; note the emerging curve. The gray cross-hairs indicate the automatically predicted gravitropic point, about 30 min after the response. The corresponding root is marked with an asterisk in C. E, The level of response is confirmed; two of the three roots are marked as having responded after 30 min, and all three roots responded by 1 h. [See online article for color version of this figure.]

