
Fig. 3.
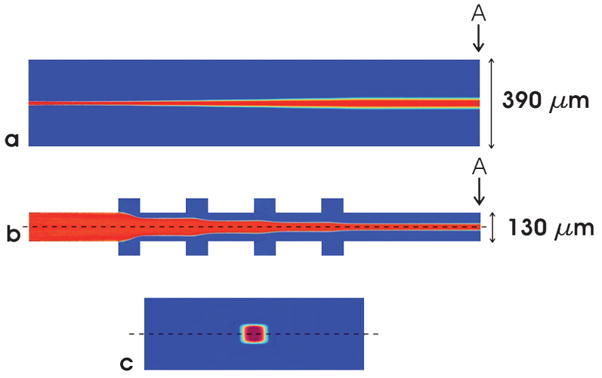
Simulation of chevron sheathing using COMSOL. The core fluid and sheath fluid enter the channel simulation from the left and flow at rates of 10 μL/min and 100 μL/min per channel, respectively. To reduce computation time, only the top half of the channel (above the dotted line) was modeled. (a) top view of channel. (b) side view of section down the middle of the channel showing chevron locations (c) sheathed core fluid as viewed at cross-section “A” (enlarged). For (b) and (c) the top half of the channel was combined with its mirror image to form a full image of the channel.