
Fig. 4.
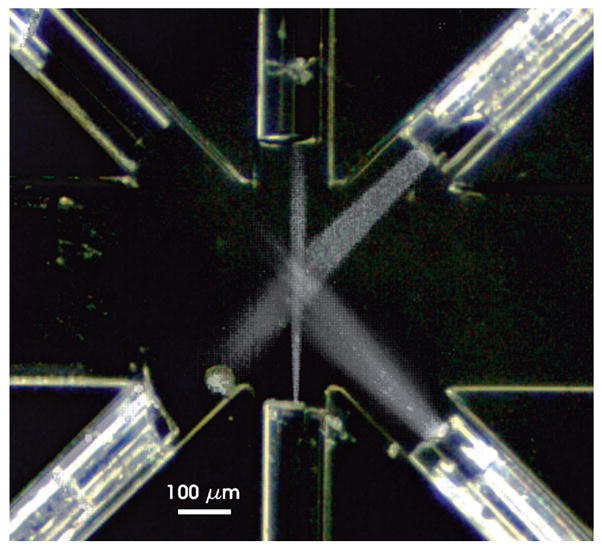
Alignment of fibers in the interrogation region. To observe the alignment of the optical fibers with the center of the flow channel, each fiber was connected to a laser while the channel was filled with Cy5 dye solution and photographed. Three images were combined to show the overlap of the output of the single mode 635 nm excitation fiber (bottom), the phycoerythrin excitation fiber (bottom right) and the acceptance angle of the microsphere identification fiber (top right).