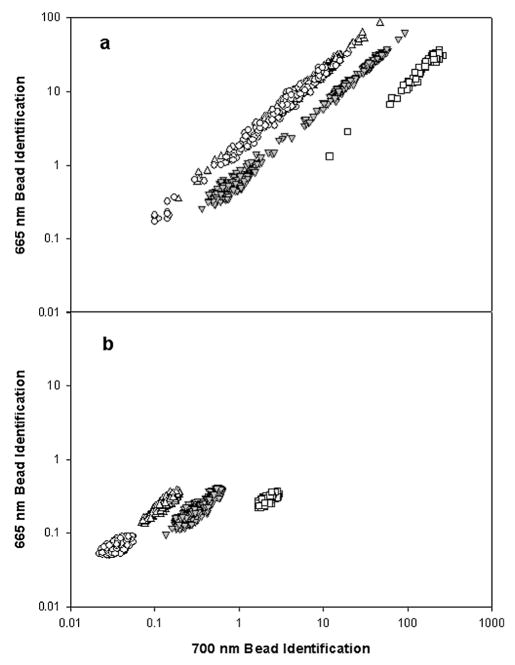
Fig. 5.
Microsphere identification plot. (a) Shown are the coded microsphere sets 50 (○), 73 (△), 77 (▽), and 81 (□). Each point represents the pulse area normalized by its width for the 665 and 700 nm microsphere identification wavelengths detected for each pulse that was over threshold. (b) Data from (a) normalized using the light scatter signal for each microsphere. Set 77 had phycoerythrin attached to the microspheres.

