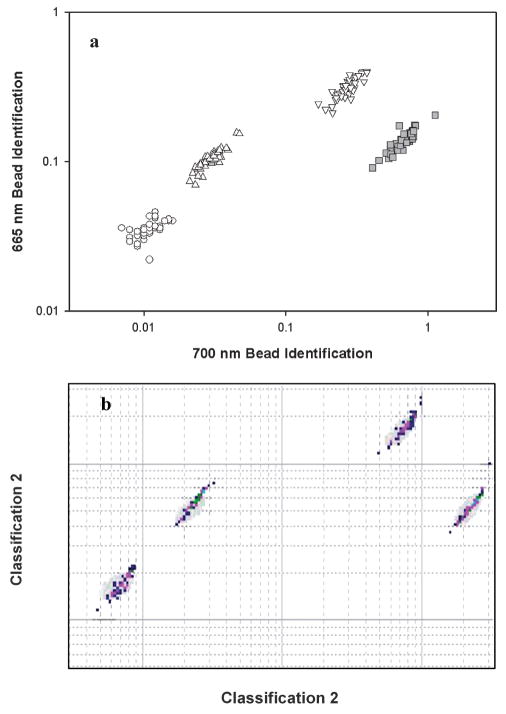
Fig. 7.
Microsphere identification plots for E. coli assays. Shown are the coded microsphere sets 50 (○), 73 (△), 81 (□) and 98 (▽), for the 107 cfu/ml sample on the (a) Microflow cytometer. Bead identification signal was pulse area normalized by scatter. Microsphere set 81 had anti-E.coli attached to the microspheres (b) bead identification from the Luminex for the same microsphere sets.

