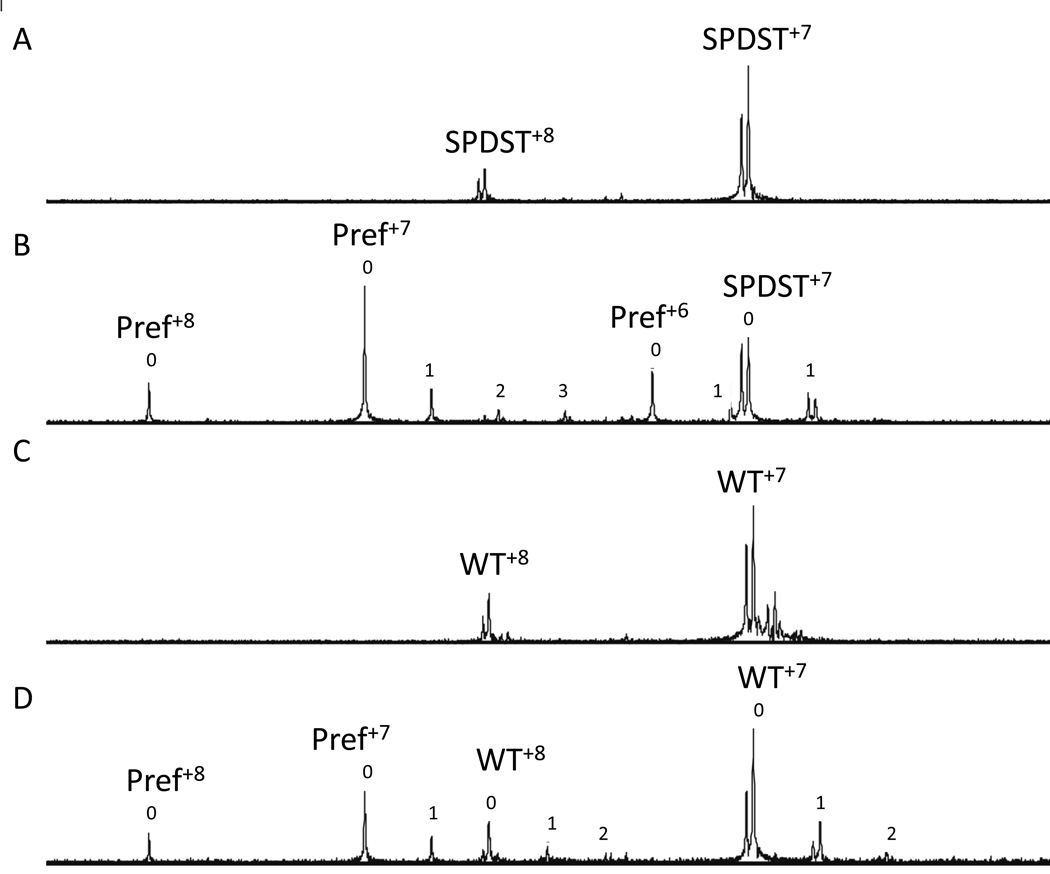
Figure 3.
NanoES mass spectra of aqueous solutions of α1GENNI➔SPDST and WT α1 bundlin. (A) 10µM solution of pure α1GENNI➔SPDST (labeled SPDST), which, typical of bundlin proteins, appears at two masses at each charge state: 17434 and 17493 Da. (B) Solution of pure α1GENNI➔SPDST (labeled SPDST) in the presence of 90 µM LacNAc-Bn and 5µM lysozyme (Pref). (C) 10µM solution of pure WT α1 bundlin, which appears at two masses: 17 472 and 17 528 Da. (D) 10µM solution of pure WT α1 bundlin in the presence of 90 µM LacNAc-Bn and 10µM Pref. Superscript numbers indicate the charge state of each protein. Peak numbers in panels C and D represent the number of LacNAc ligands associated with each protein. The relative proportion of Pref which was non-specifically associated with LacNAc was subtracted from the relative proportion of bundlin associated with LacNAc to calculate specific binding.

