
Fig. 1.
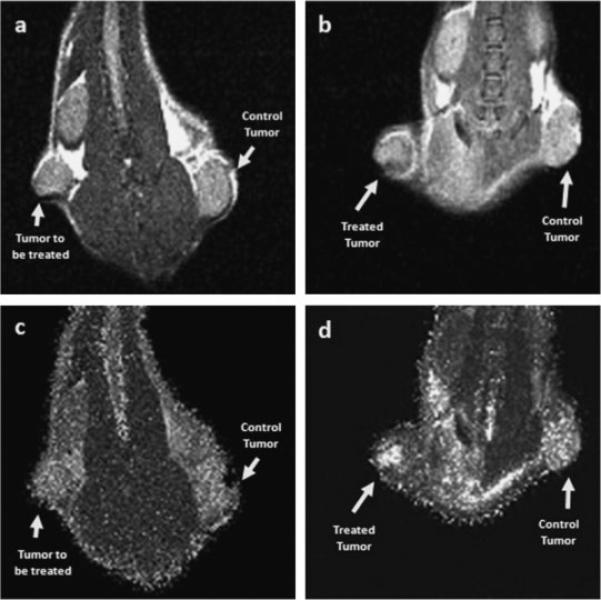
MR images of a tumor-bearing mouse (M10) pre-PDT (a) and 24 hours after PDT (b). The images were acquired using a multi-slice multi-echo (MSME) MR sequence with the following imaging parameters: TE = 10.25, 20.50, 30.75, and 41.00 milliseconds; TR = 1,280 milliseconds; FOV = 3.5 cm × 3.5 cm; Matrix size: 128 × 128. The MR images shown here were reconstructed from the first echo. The signal intensity values changed 24 hours after the treatment. MR images from four echoes were used to calculate T2 maps. Compared to the T2 map before PDT (c), the T2 values increased 24 hours after the treatment (d), especially within the treated tumor (arrow).