
Fig. 3.
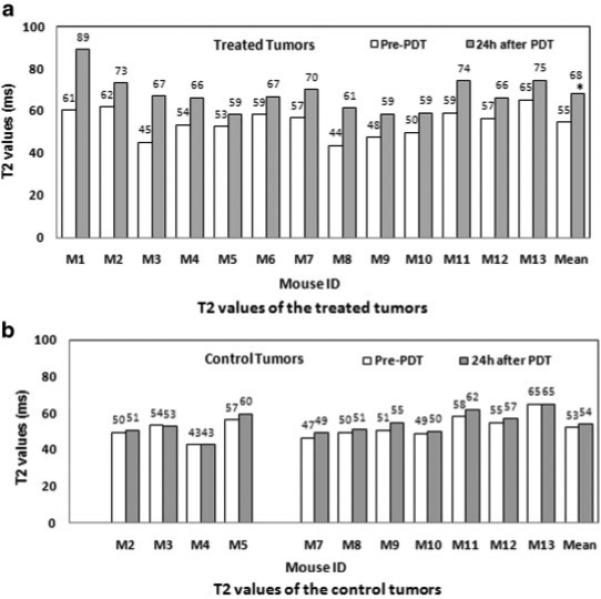
T2 values of the treated and control tumors for 13 mice (M1-M13). a: For the treated tumors, the mean T2 values are 55.8 ± 6.6 and 68.2 ± 8.5 milliseconds pre-PDT and 24 hours after PDT, respectively. An asterisk is placed at the mean T2 value of treated tumors and the T2 values are significantly different for these two time points (P < 0.0002). b: For the control tumors, the mean T2 values are 52.5 ± 6.1 and 54.3 ± 6.4 milliseconds pre-PDT and 24 hours after PDT, respectively. M1 and M6 each had a small control tumor, which was not included in this study. There is no significant difference between the T2 values at the two time points studied (P = 0.53).