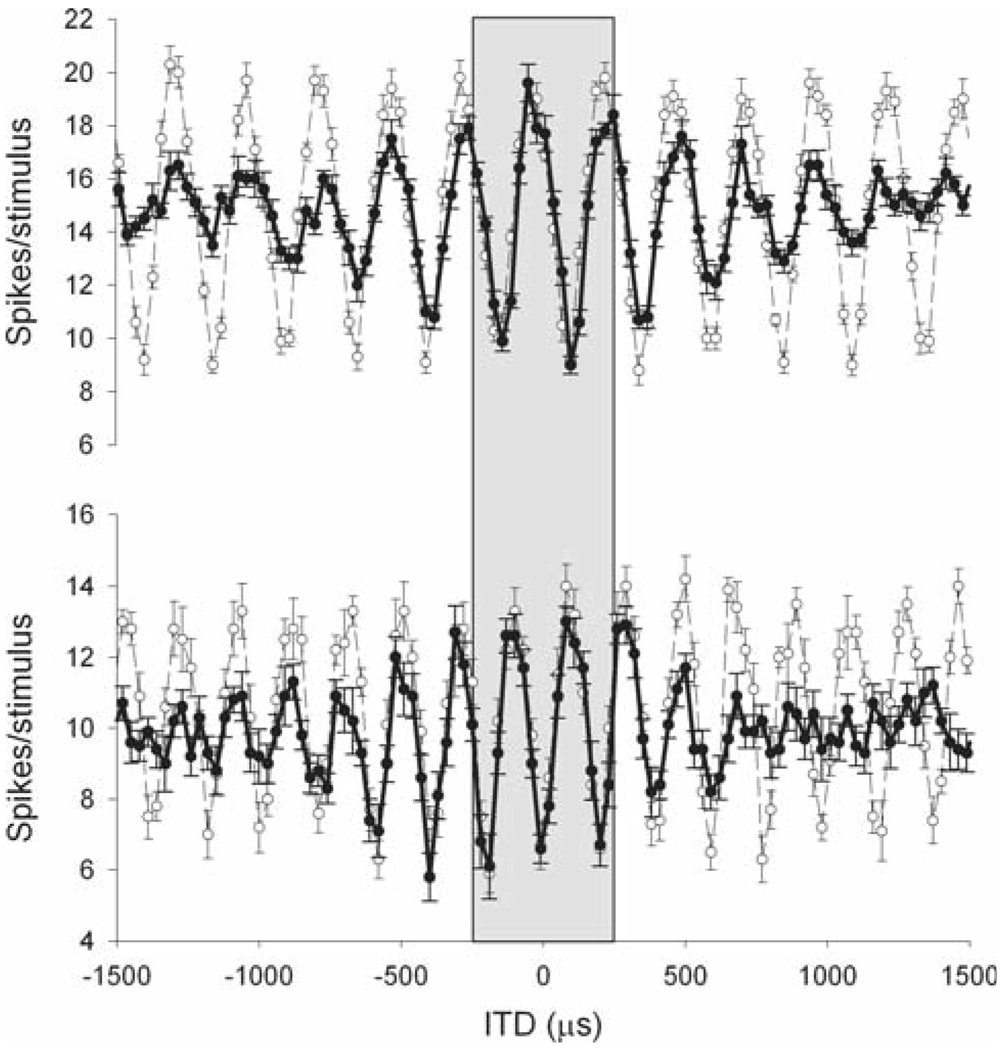
Fig. 1.
Example of long-range ITD-curves for two laminaris neurons. When the range of ITDs presented is expanded, a more complex structure becomes evident. Whereas the response is periodic for tonal stimulation (thin line), the amplitude of the peaks decays in response to a broadband sound as a result of the bandpass filtering of signals in the cochlea (bold line). However, for the physiological range of ±250 µs (Keller et al. 1998; Poganiatz et al. 2001; von Campenhausen and Wagner 2006) the responses to tones and broadband signals can be practically indistinguishable (gray area). This becomes significant at higher frequencies, when peaks of similar amplitude occur in the physiological range. Tonal stimulation: 4 kHz (top), 5.1 kHz (bottom)

