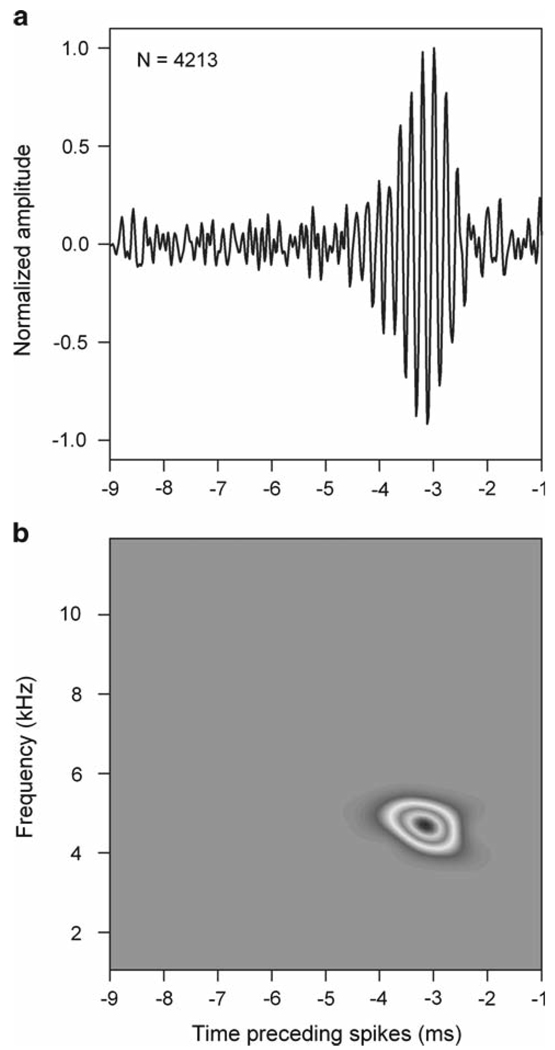
Fig. 3.
Spike-triggered average (STA) and spectrogram in NL. a Example STA in NL. The abscissa indicates time preceding the spike. The number of spikes used to compute the STA is indicated on the plot. b Spectrogram of the STA shown in a, showing the frequency range and latency of aspects of the sound linked to the generation of spikes

